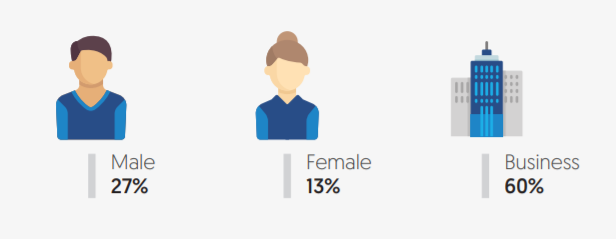
E-commerce allows consumers to electronically exchange goods and services through the internet. The term e-commerce is mostly used to describe online shopping platforms where customers can browse and order products to be delivered to them. We conducted
Social Media in E-commerce Activities
Which MENA Countries Were The Most Active?
While the level of activity is different, the most active countries in terms of Social media in E-commerce did not change in order from 2016. Saudi Arabia was and still is the most active, owning 56% of the 2017 buzz, followed by UAE which owned 11% of the buzz, Egypt with 9%, Kuwait with 3%, and finally Oman with only 1%. The top active countries owned an accumulative of 80% of the whole E-commerce buzz.
Who Was Active In Which Countries?
- Business Accounts
Business accounts owned the majority of
- Male Users VS Female Users
Male users were the second most active after business accounts. They’re
Female users weren’t as active at all. They were at their highest activity rate in UAE, where they composed 8% of the
Which Language Did Users Use In Every Country?
Arabic dominated the content of all countries except UAE. Perhaps that’s due to the diversity of users in the market. Aside from UAE, Arabic was mostly utilized in Saudi Arabia, where it represented 97% of the Saudi buzz. In UAE, 59% of the published content was in English.
Which Market Was Most Sentimental?
Oman was the highest in sentiment, as 15% of its buzz expressed an opinion. Omanis had the highest number of sentimental posts with 15% of their activities expressing opinions. The lowest sentiment activities percentage came from Kuwait that had almost 93% of its activities as neutral. Positive activities were significantly higher than negative in all countries.
E-commerce Across Different Platforms
How Did Business Accounts & Genders Contribute to The Content of Different Platforms?

- Business Accounts
Business accounts owned the majority of content published on blogs and news websites. Individual users usually do not prefer to publish their content on blogs and news websites, or even interact on them. This is why these platforms are often reserved for business accounts.
- Male Users VS Female Users
Male users dominated the majority of users’ content on all social media platforms and forums, except for Instagram, which was dominated by female users’ content with 29%, faced by 23% by male users. Male users owned the majority of content on Facebook and Twitter with 51% respectively. They also composed 45% of the content on Forums.
Which Platforms Were Used to Express Sentiment?
Forums contained more sentiment than any other monitored platform, as sentimental content composed 28% of the buzz on these platforms. Blogs were dominated by neutral content, as no more than 3% of their content expressed an opinion or a sentiment. Generally, social media in e-commerce maintained a positive sentiment across all platforms except on Facebook, on which the 14% sentimental content was split equally between negative and positive content.
Business Accounts, Male & Female Users: Who Published What?
Which Platform Did Users Prefer?
- Business Accounts
50% of business accounts preferred to publish their content on Twitter, followed by 38% who preferred to publish their posts on Facebook. Meanwhile, they were the only ones that used blogs and news websites.
- Male Users VS Female Users
Female users were more fond of Twitter, as 60% of their content was published on the platform. They were also more interest in Instagram than male users, as they published 10% of their content on Instagram, while only 3% of male users’ content was published on Instagram. 38% of male users preferred Facebook over any other platform, while only 30% of female users published on Facebook.
Sentiments across gender
- Business Accounts
The vast majority of 99% of business accounts content was neutral. Only 1% of the content expressed a positive sentiment, and none expressed any negative sentiment.
- Male Users VS Female Users
Positive is the dominating sentiment in both males and females. However, male users are slightly more sentimental than female users having 18% of their activities with sentiment compared to female users with 16%.
Which Language Did Users Prefer?
The vast majority of content was published in Arabic, ranging between 79% and 87%. Male users were the
Arabic & English E-Commerce
Compared to 2016, English is more frequently used in 2017 as 34% of the content was in English, while in 2016 it composed no more than 13%. On the other hand, the usage of Arabic decreased to 66% in 2017 from 87% in 2016.
How Was Language Affected By Business Accounts & Individual Users?
As for the used languages on social media in e-commerce, the Arabic language was more frequently used by the male users while English was used by business accounts the most. Female users had the lowest participation in both languages.
Which Platforms Were Most Used For Arabic & English?
Twitter contained the majority of content for social media in e-commerce in both languages, followed by Facebook. 83% of Arabic content was on Twitter, while 11% of the language’s content was on Facebook. Meanwhile, 65% of the English content was on Twitter, followed by 22% on Facebook. Instagram wasn’t a favorite social media platform for users of both languages as it hosted no more than 10% of the English content and 6% of the Arabic content. It’s remarkable that news websites and blogs were only used for English content.
Check out more exciting insights in our recent blog article on social media in the Banking sector which is also part of The State Of Social Media Report. With insights covering the overall state of social media within the Banking sector in the MENA region.
What Sentiment Did The Buzz Present?
Sentimental posts decreased noticeably in 2017. In 2016, sentimental posts composed 32% of the E-commerce buzz. In 2017, only 12% of the content revealed a sentiment. The decrease in Sentimental posts on social media in e-commerce could be based on that people were more vocal in expressing opinions earlier as the e-commerce sector was relatively new.
Who Published Sentimental Content?
- Business Accounts
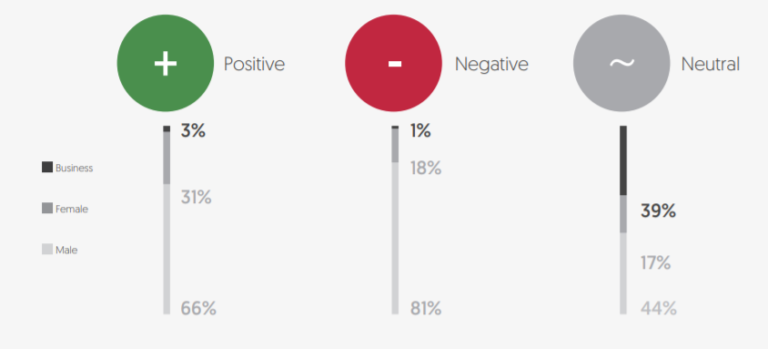
Business accounts are always for publishing neutral content, as these accounts composed 39% of the neutral buzz. Meanwhile, their contribution to the positive and negative buzz did not exceed 3% and 1% respectively.
- Male Users VS Female Users
Male users composed most of the content of the positive and negative buzz with 66% and 81% respectively. Female users owned more of the positive content than the negative one. 31% of the positive posts were owned by female users while their contribution to the negative buzz was 18%.
Which Platforms Displayed Sentiment?
Twitter was the most used channel by users interested in E-commerce for all sentiments, as it contained a range between 67% and 73% of sentimental content. Facebook came as the second most preferred platform, containing a range between 18% and 27% of sentimental content.
The Social Media in E-commerce is only one of 8 industries that were covered in the State of Social Media 2018. Download your free copy to access the comprehensive report with all the data and insights.


