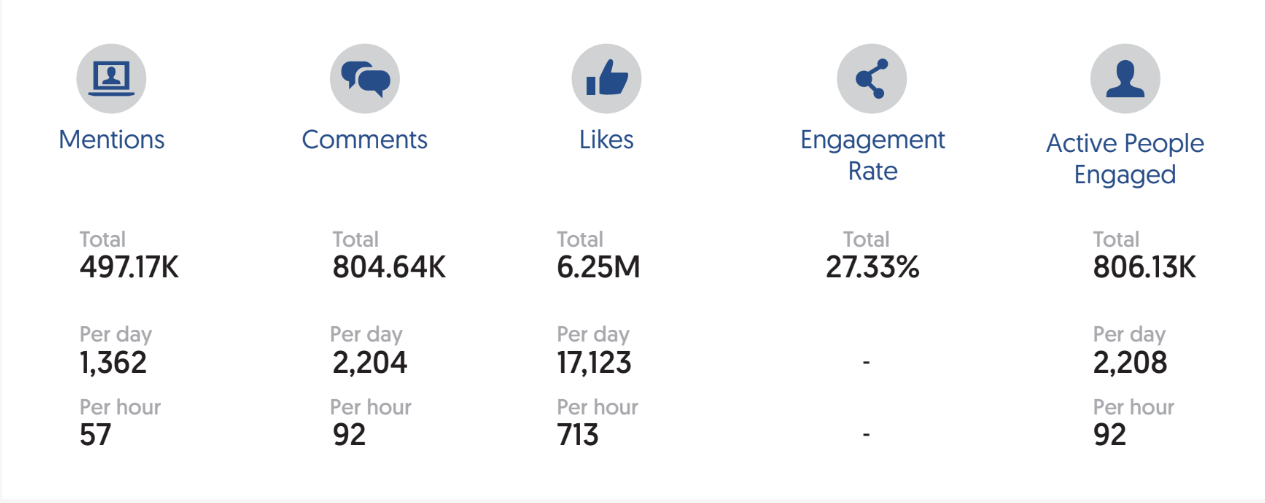
Ride-Hailing refers to transportation solutions provided by specialized companies substituting traditional taxis. Our study focused on the analysis of social media accounts of companies that represent the ride hailing market leaders of the region. We conducted thorough analysis on social media in ride hailing services within the MENA region in 2018. Across a whole year, we managed to collect and monitor the activities within the ride hailing industry in order to get all the insights that will definitely be useful to many marketers and professional. The analysis we conducted, as part of the State of Social Media, includes insights and analytics of mentions and social handles of the top two ride hailing companies in the MENA region. All data in this article is generated through the Crowd Analyzer tool.
Ride Hailing Activities On Social Media
Most Active Countries
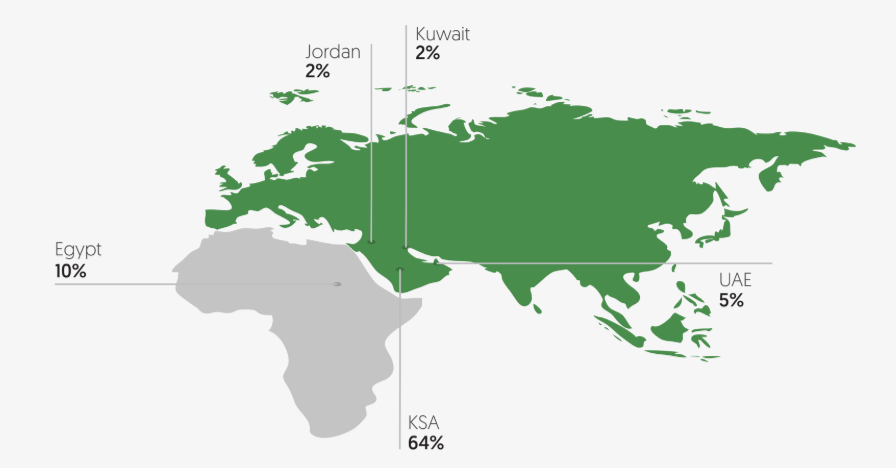
These Top 5 countries in the MENA region owned around 83% of the total activities of the whole buzz. GCC countries owned 71% of the activities solely.
Who Contributed to The Buzz In Each Country?
- Business Accounts
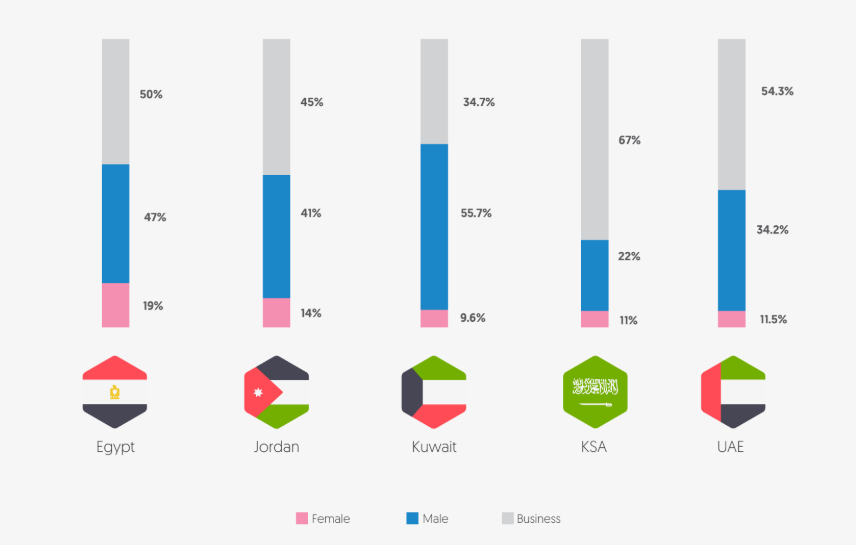
Business accounts’ highest activity was in UAE, where they owned a majority of 54% of the content, followed by Jordan with 41% of the country’s buzz generated by business accounts. Business accounts were at their lowest activity in Saudi Arabia where they only owned 22% of the country’s buzz.
- Male Users VS Female Users
Male users were the most active in 4 of the 5 top countries. Their highest activity was in Saudi Arabia, where they owned 67% of the content, followed by Kuwait where they owned 56% of the country’s buzz. Yet, their lowest activity rate was in UAE, where they owned 34% of the buzz. Female users weren’t as active as their male counterparts, yet they were most active in Egypt; owning 19% of the content.
Which Language Was Preferred In The Top 5 Countries?
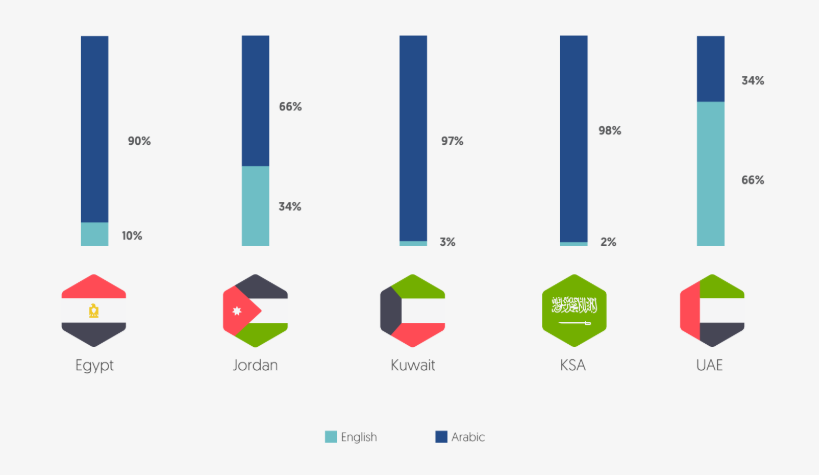
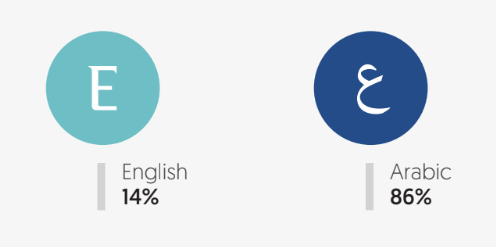
Understanding which language to use for your industry differs according to the country your company is targeting. Hence, analyzing the preferred language in each country is an essential part of any marketing strategy. In this buzz, Arabic was the most used language by users across the region, except in UAE, where 66% of the content was in English. Saudi Arabia, Kuwait, and Egypt had a majority of more than 90% of Arabic content. Jordan had 66% of its content in Arabic and 34% in English.
Which Sentiment Dominated Activities In Each Country?
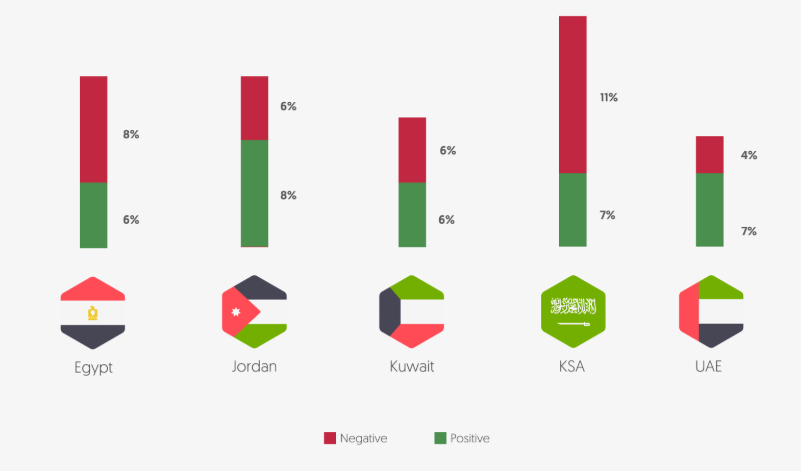
The most active country in the sentimental posts is Saudi Arabia, which displayed sentiment in 18% of its content. UAE revealed the least sentiment in their content, which represented no more than 11% of the country’s buzz. Saudi Arabians and Egyptians published more negative content on social media, while Jordanians and Emiratis were more positive towards the topic.
Online Platforms & Ride Hailing
How Did Business Accounts & Individual Users Utilize Each Platform?
- Business Accounts
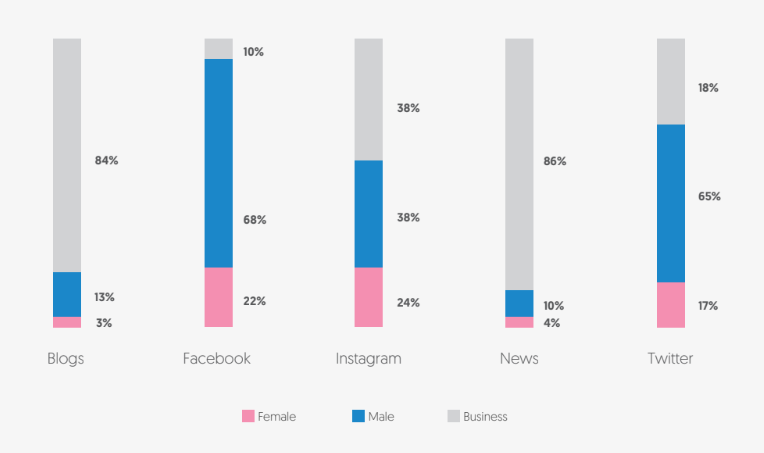
For blogs and news website, business accounts were the highest contributors. They composed more than 84% on both platforms while falling behind on social media platforms such as Twitter, Facebook, and Instagram, where individual users dominated the buzz.
- Male Users VS Female Users
Male users had the highest amount of activities on Facebook and Twitter. Female users had the minimum participation in all channels but their highest were Facebook and Instagram where they owned 23% of the content.
Which Platforms Contained More Sentimental Posts?
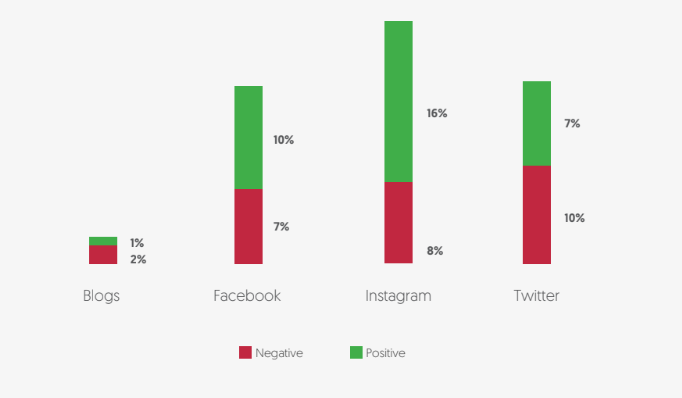
Instagram was the highest network of sentimental activities, as sentiment was revealed in 24% of the published content. Positive activities were higher than negatives in all networks except for blogs and Twitter where negative content exceeded positive content.
Business Accounts, Male Users, & Female Users
Who Contributed to The Buzz of Different Platforms?
- Business Accounts
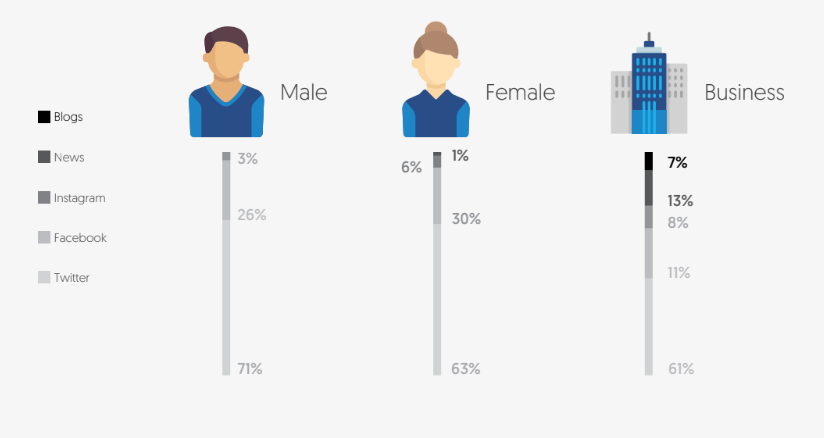
Business accounts, as well as individual users, preferred to publish their content on Twitter. Also, they published a remarkable amount of content on all other platforms, unlike individual users who were selective with the platforms they use.
- Male Users VS Female Users
As for females and males, Twitter was followed by Facebook and Instagram then females had a small sector of 1% for news channels.
Who Revealed More Sentiment in Their Content?
- Business Accounts
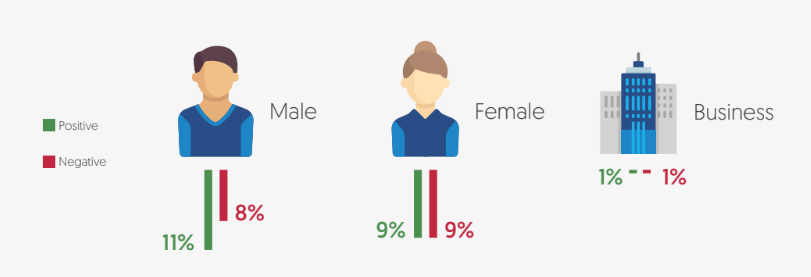
As we’re used to, business accounts did not reveal much sentiment in their content. Only 2% was distributed equally between positive and negative content.
- Male Users VS Female Users
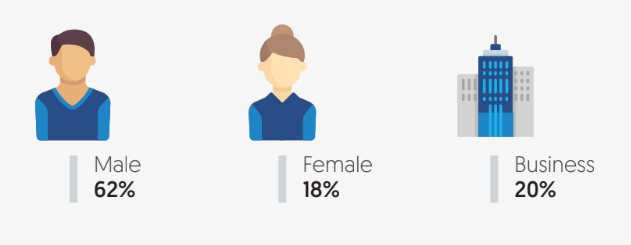
Male users published more positive content than female users. Also, male users were more expressive in their content as sentimental posts composed 19% of their buzz, while female had 18%.
Which Language Did Business Accounts & Individuals Prefer?
- Business Accounts
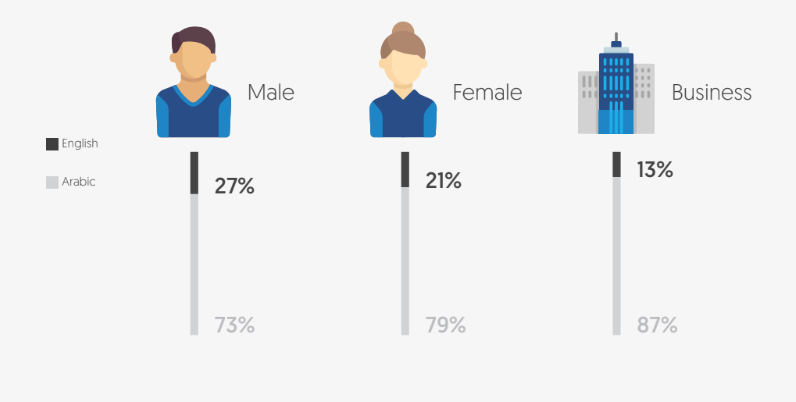
Business accounts wrote the majority of their content in Arabic. However, they also owned the largest English buzz compared to individuals, as they had 27% of their content in English.
- Male Users VS Female Users
Male users were the most to use Arabic in their content about Ride Hailing, as 87% of their content was in Arabic. On the contrary, 21% of female users’ content was in English, keeping them in the middle between male users and business accounts.
Arabic Or English? How Was Language Used With Ride Hailing?
How Did Business Accounts & Individuals Contribute to Language?
- Business Accounts
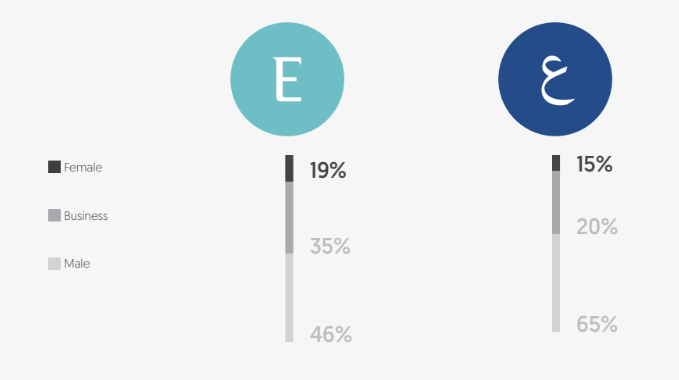
Business accounts were the second most active after male users. Their contribution had a bigger effect on the English buzz, as they owned 35% of it. They remaining the second most contributing to the Arabic buzz, owning 20% of the content.
- Male Users VS Female Users
Activities in Arabic were owned mainly by male users who composed 65% of the Arabic buzz. Meanwhile, female users were more prone to use English as their contribution to the English content was 19%, while they owned 15% of the Arabic buzz. Male users still owned the majority of activities in both languages.
Which Platforms Hosted The Arabic & English Content?
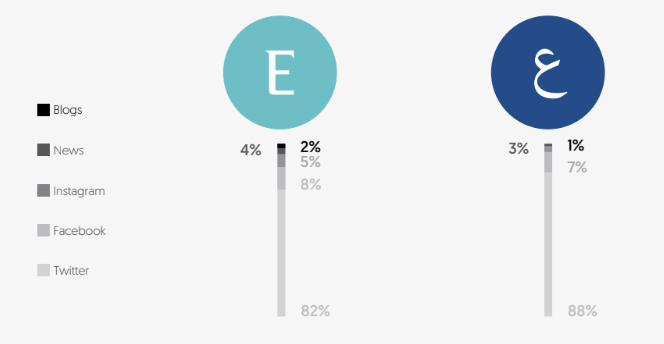
The vast majority of the content in both languages was published on Twitter. However, only English content was posted on blogs that were not utilized for Arabic. While the news websites contained 3% of the content of the English buzz, while only 1% of the Arabic buzz was hosted on news websites.
Check out more exciting insights in our recent blog article on social media in the Media industry which is also part of The State Of Social Media Report. With Social Media insights comparing Online TV Vs. Offline TV service providers in the MENA region.
What Does Sentiment Say About Ride Hailing?
Who Expressed More Satisfaction in the Industry?
- Business Accounts
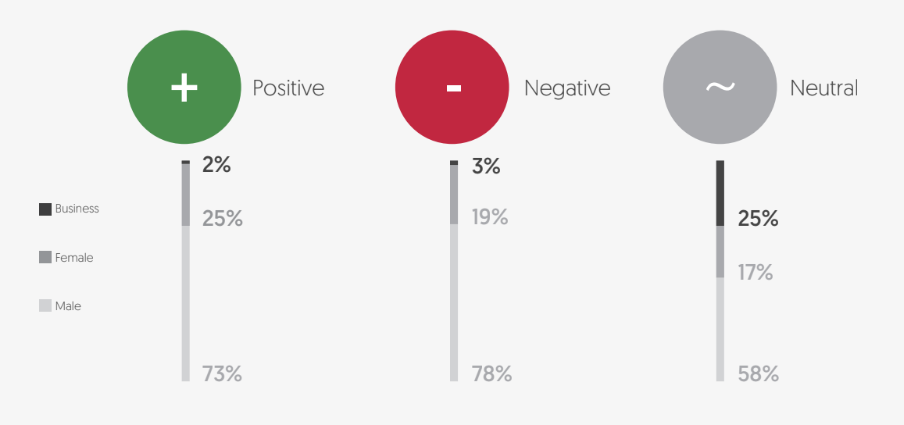
Business accounts were responsible for 25% of the neutral activities and barely contributed to the sentimental content. Business accounts were the least participating in the content as they came in the third place.
- Male Users VS Female Users
Male users were the most expressive, owning the majority of positive as well as negative content about ride hailing. Meanwhile, female users expressed more positive sentiment as they owned 25% of the positive content, while they owned 19% of the negative one.
How Was Sentiment Distributed Across Platforms?
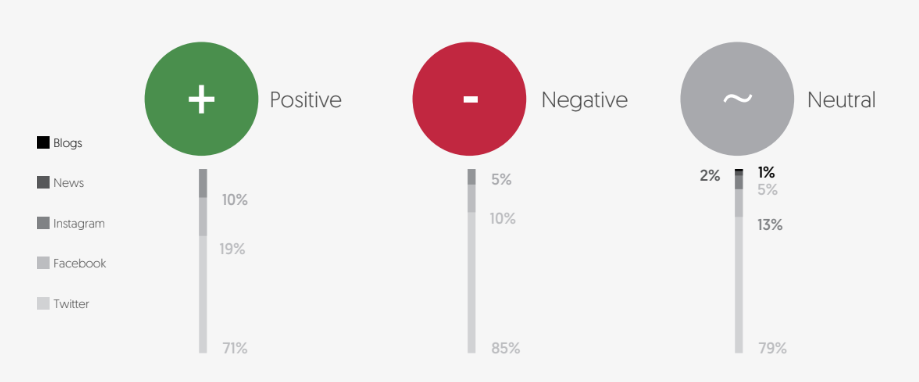
Twitter was the platform that hosted most of the content in general, however, it was more utilized to express negative content in 85% of the times. While it was least utilized for positive content. Facebook and Instagram were utilized more for positive content, while they were least used for negative content. The content of news websites and blogs did not reveal any sentiment, as all of their content was neutral.
Ride hailing is only one of 8 industries that were covered by in the State of Social Media 2018. Download your free copy to access more data and insights.

